Read And Plot Data Expectancy in The Python Assignment Solution
.svg)
- Instructions
- Requirements and Specifications
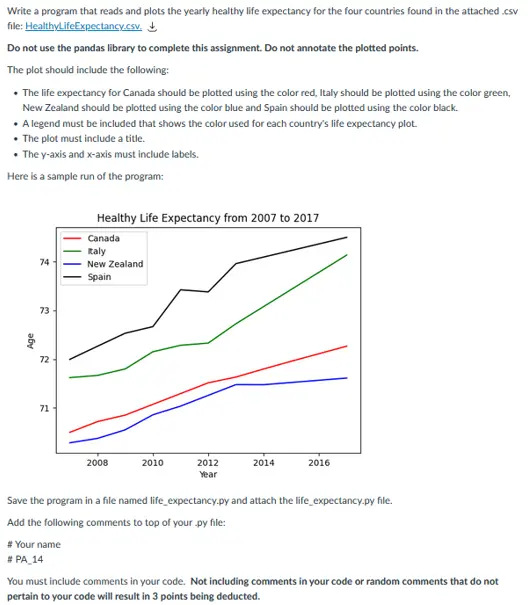
Instructions
Requirements and Specifications
Source Code
# Your Name
# PA_14
import numpy as np
import matplotlib.pyplot as plt
import re
def build_plot(map):
"""
Method for building plot from given data dictionary
:param map: data dictionary
:return: None
"""
# getting years values as x-axis
years = map['Year']
axes = plt.gca()
# setting plot view parameters
axes.set_title('Health Life Expectancy from 2007 to 2017')
axes.set_xlim(2007, 2017)
axes.set_ylim(70, 75)
axes.set_xlabel('Year')
axes.set_ylabel('Age')
axes.set_title('Health Life Expectancy from 2007 to 2017')
# creating graphs for each of country
plt.plot(np.array(years), np.array(map['Canada']), color="red", linewidth=2, linestyle="-", label='Canada')
plt.plot(np.array(years), np.array(map['Italy']), color="green", linewidth=2, linestyle="-", label='Italy')
plt.plot(np.array(years), np.array(map['New Zealand']), color="blue", linewidth=2, linestyle="-", label='New Zealand')
plt.plot(np.array(years), np.array(map['Spain']), color="black", linewidth=2, linestyle="-", label='Spain')
# showing legend
axes.legend()
# saving picture as png
plt.savefig('life_exp.png')
# showing result plot
plt.show()
def read_data(filename):
"""
Method for reading data from given filename
:param filename: file to read data from
:return: dictionary, containing read data
"""
# result dictionary: maps column name to value list
result = {}
# mapping column index to column name
columns = {}
# reading csv file
with open(filename, 'r') as csvfile:
# reading lines
lines = csvfile.read().splitlines()
# removing 'wrong' byte at the beginning of file
lines[0] = re.sub(r"[^ a-zA-Z,]", "", lines[0])
# getting headers
header = lines[0].split(',')
# processing header values
for i in range(len(header)):
columns[i] = header[i]
result[header[i]] = []
# parsing line by line and enriching collected data
for line in lines[1:]:
parts = line.split(',')
for i in range(len(parts)):
result[columns[i]].append(float(parts[i]))
return result
if __name__ == '__main__':
# filename to read data from
filename = 'HealthyLifeExpectancy.csv'
# reading data and building plot
build_plot(read_data(filename))
Related Samples
Explore Python Assignment Samples: Dive into our curated selection showcasing Python solutions across diverse topics. From basic algorithms to advanced data structures, each sample illustrates clear problem-solving strategies. Enhance your understanding and master Python programming with our comprehensive examples.
Python
Python
Python
Python
Python
Python
Python
Python
Python
Python
Python
Python
Python
Python
Python
Python
Python
Python
Python
Python