Instructions
Objective
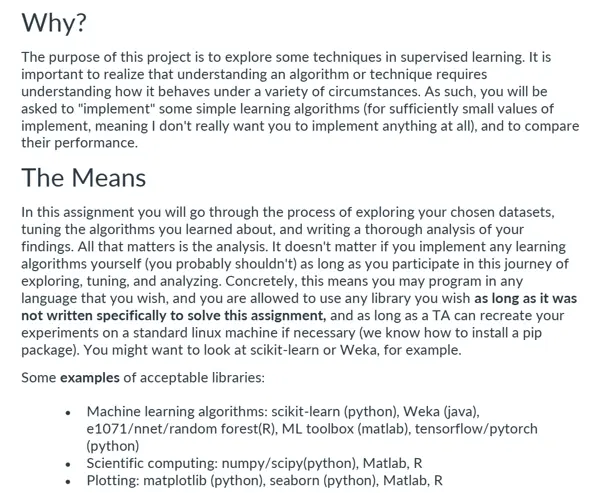
Write a python assignment program to implement machine learning in python language.
Requirements and Specifications

.webp)
Source Code
from sklearn.datasets import load_digits

from sklearn.model_selection import train_test_split

from sklearn.neural_network import MLPClassifier

from sklearn.ensemble import GradientBoostingClassifier

from sklearn import svm

from sklearn.neighbors import KNeighborsClassifier

from sklearn import tree

import matplotlib.pyplot as plt

import numpy as np

"""### Import Dataset"""

from sklearn.datasets import load_digits

digits = load_digits()

"""## Display first 16 images"""

plt.figure(figsize = (5,5))

for i in range(16):

plt.subplot(4,4,i+1)

plt.xticks([])

plt.yticks([])

plt.grid(False)

p; plt.imshow(digits.images[i], cmap = plt.cm.binary)

plt.xlabel(digits.target[i])

"""## Organize dataset into X and y"""

n_samples = len(digits.images)

X = digits.images.reshape((n_samples, -1))

y = digits.target

"""## Split dataset into training and test"""

X_train, X_test, y_train, y_test = train_test_split(X, y, test_size = 0.3, shuffle = True) # Usea 33% of the dataset for test

"""## Model 1: Decision Tree

For this model, we will vary the depth of the tree and see when the accuraci stops increasing

"""

tree_accuracies = []

for d in range(1, 1001):

model1 = tree.DecisionTreeClassifier(max_depth=40)

model1 = model1.fit(X_train, y_train)

# Measure Accuracy

y_pred = model1.predict(X_test)

acc1 = np.sum(np.where(y_pred == y_test))/n_samples

tree_accuracies.append(acc1)

plt.figure()

plt.plot(range(1,1001), tree_accuracies)

plt.xlabel('Depth')

plt.ylabel('Accuracy')

plt.grid(True)

plt.title("Accuracy vs. Tree depth")

plt.show()

#print("The accuracy of the Decision Tree model is {:.2f}%".format(acc1))

"""We don't see that the accuracy stops increasing, it just oscillates. So, we will just get the depth that returned the highest accuracy and build the model with that value"""

idx = np.argmax(np.array(tree_accuracies))

highest_acc = tree_accuracies[idx]

optimal_depth = range(1,1001)[np.argmax(np.array(tree_accuracies))]

model1 = tree.DecisionTreeClassifier(max_depth=optimal_depth)

model1 = model1.fit(X_train, y_train)

y_pred1 = model1.predict(X_test)

acc1 = np.sum(np.where(y_pred1 == y_test))/n_samples

print("The highest accuracy of the Decision Tree Model is obtained with a depth of {0} and is {1:.2f}%".format(optimal_depth, highest_acc))

"""## Model 2: Neural Network (MLP Classifier)

### First, with SGD optimizer

"""

model2 = MLPClassifier(hidden_layer_sizes=(50, ), max_iter=100, alpha=1e-4,

solver='sgd', random_state=1, learning_rate_init=.01)

model2.fit(X_train, y_train)

# Measure accuracy

y_pred2 = model2.predict(X_test)

acc2 = np.sum(np.where(y_pred2 == y_test))/n_samples

print("The accuracy of the MLP model with SGD is {:.2f}%".format(acc2))

"""### Now, with ADAM optimizer"""

model2 = MLPClassifier(hidden_layer_sizes=(50, ), max_iter=100, alpha=1e-4,

solver='adam', random_state=1, learning_rate_init=.01)

model2.fit(X_train, y_train)

# Measure accuracy

y_pred2 = model2.predict(X_test)

acc2 = np.sum(np.where(y_pred2 == y_test))/n_samples

print("The accuracy of the MLP model with Adam is {:.2f}%".format(acc2))

"""## Model 3: Boosting"""

model3 = GradientBoostingClassifier(n_estimators=100, learning_rate=1e-1, max_depth=1, random_state=0)

model3.fit(X_train, y_train)

# Measure accuracy

y_pred3 = model3.predict(X_test)

acc3 = np.sum(np.where(y_pred3 == y_test))/n_samples

print("The accuracy of the Boosting model is {:.2f}%".format(acc3))

"""## Model 4: Support Vector Machine"""

model4 = svm.SVC()

model4.fit(X_train, y_train)

# Measure accuracy

y_pred4 = model4.predict(X_test)

acc4 = np.sum(np.where(y_pred4 == y_test))/n_samples

print("The accuracy of the Support Vector Machine model is {:.2f}%".format(acc4))

"""## Model 5: K-Nearest Neighbors

For this case, we will test with k = 1, 2, ..., 10 and check which value of k returns the highest accuracy. Note that we test up to k = 10 since there are only 10 classes

"""

k_accuracies = []

for k in range(1,11):

model5 = KNeighborsClassifier(n_neighbors=k)

model5 = model5.fit(X_train, y_train)

# Measure accuracy

y_pred5 = model5.predict(X_test)

acc5 = np.sum(np.where(y_pred5 == y_test))/n_samples

k_accuracies.append(acc5)

plt.figure()

plt.plot(range(1,11),k_accuracies)

plt.xlabel('k')

plt.ylabel('Accuracy')

plt.grid(True)

plt.title("Accuracy (%) vs. number of Neighbors (k)")

plt.show()

# Get optimal value of k

optimal_k = range(1,11)[np.argmax(np.array(k_accuracies))]

print(f"The optimal value of k is k = {optimal_k}")

"""Now, the highest value of **k** is used for the final version of the model"""

model5 = KNeighborsClassifier(n_neighbors=optimal_k)

model5 = model5.fit(X_train, y_train)

# Measure accuracy

y_pred5 = model5.predict(X_test)

acc5 = np.sum(np.where(y_pred5 == y_test))/n_samples

print("The accuracy of the K-Nearest Neighbors model is {:.2f}%".format(acc5))

"""## Bar Graph showing Accuracies"""

accuracies = [acc1, acc2, acc3, acc4, acc5]

models = ["Decision Tree", "Neural Network", "Boosting", "SVM", "K-Nearest"]

plt.figure(figsize=(10,10))

plt.bar(models, accuracies, width=0.5)

plt.grid(True)

plt.show()

"""It can be seen that, the best model is th
Similar Samples
Explore our curated collection of programming homework samples showcasing our expertise across various languages and topics. These samples demonstrate our commitment to delivering high-quality solutions tailored to your academic needs. Whether you're tackling Java assignments or Python projects, our examples highlight our proficiency in programming concepts and problem-solving skills.
Python
Python
Python
Python
Python
Python
Python
Python
Python
Python
Python
Python
Python
Python
Python
Python
Python
Python
Python
Python
