Create a Program to Implement K Means Clustering in Python Assignment Solution
.svg)
- Instructions
- Requirements and Specifications
Instructions
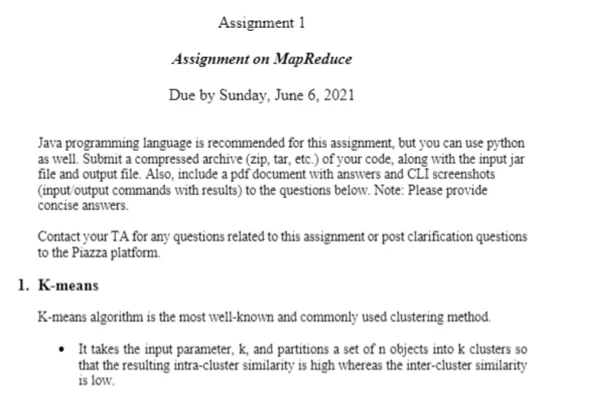
Objective
Write a python assignment program to implement K means clustering.
Requirements and Specifications
Source Code
import numpy as np
from scipy.spatial.distance import cdist
import matplotlib.pyplot as plt
data = np.loadtxt('data_points.txt', delimiter=',')
data.shape
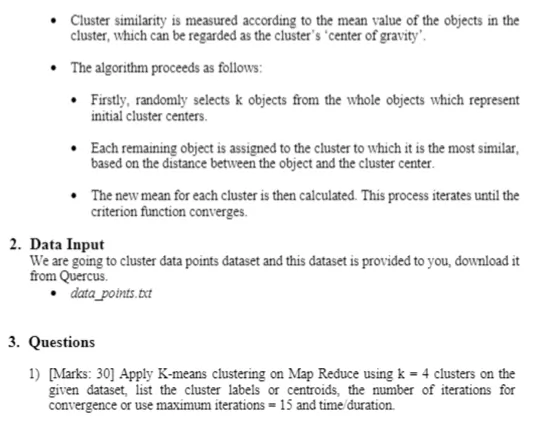
### Define number of clusters, tolerance and maximum number of iterations
K = 4
tol = 1E-6
max_iters = 15
### Pick centroids
centroids = data[np.random.choice(data.shape[0], K),:]
print(centroids)
### Begin with K-Means Clustering Algorithm
# Define a numpy array to label each point
labels = np.zeros((data.shape[0],1))
# Define initial error
err = 1E10
iters = 0
while err > tol and iters < max_iters:
# Calculate distances to centroids
distances = cdist(data, centroids)
# Pick the minimum distance index
idx = np.argmin(distances, axis = 1)
# Now, update centroids
old_centroids = centroids.copy()
for k in range(K):
# Calculate the new value of centroid k
idxs_ = np.where(idx == k)[0]
centroid = np.mean(data[idxs_], axis = 0)
centroids[k] = centroid
labels[idxs_] = k
# Now, compute error
err = np.max(np.abs(old_centroids - centroids))
iters = iters + 1
# Print
print("Iteration {0}, error = {1:.8f}".format(iters, err))
### Plot centroids and points
plt.figure()
for k in range(K):
idxs_ = np.where(labels == k)[0]
p = data[idxs_,:]
plt.scatter(p[:,0], p[:,1], label = f"K = {k}", marker="+")
# Plot centroids
plt.scatter(centroids[:,0], centroids[:,1], color='black', marker = "x")
Related Samples
Explore our free Python assignment samples for clarity and better understanding. These samples offer detailed solutions and practical examples, making Python concepts easier to grasp and apply.
Python
Python
Python
Python
Python
Python
Python
Python
Python
Python
Python
Python
Python
Python
Python
Python
Python
Python
Python
Python