Create a Program to Implement Data Preparation in Python Assignment Solution

- Instructions
- Objective
- Requirements and Specifications
Instructions
Objective
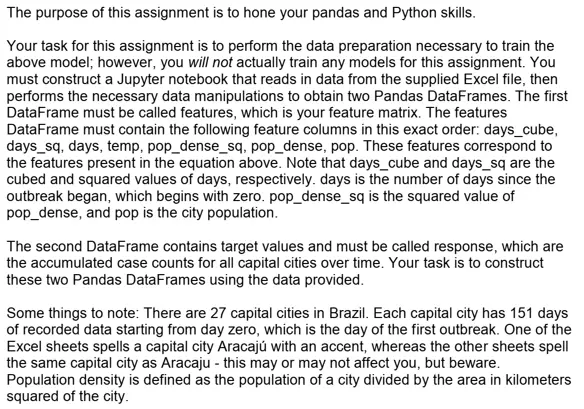
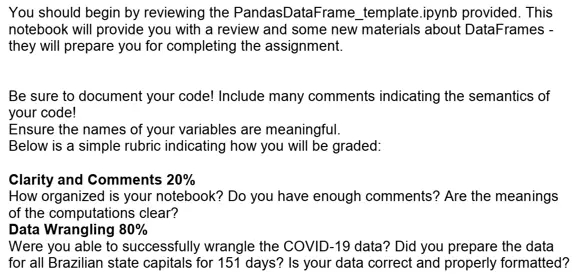
Write a program to implement data preparation in python language.
Requirements and Specifications
Source Code
#**4.**

 import pandas as pd

 # reading and converting the data ito pandas Dataframe

 data = pd.read_csv("spahn.csv")

 # applaying pandas method .describe()

 data.describe().T

 import pandas as pd

 # reading and converting the data ito pandas Dataframe

 data = pd.read_csv("spahn.csv")

 # applaying pandas method .describe()

 data[['ERA+']].describe()

data[['SO']].boxplot()

data[['ERA']].boxplot()

data[['ERA+']].boxplot()

#**5.**

data = pd.read_csv('d5000.csv')

data.head()

data.describe()

data.plot.scatter(x = 'HR', y = 'SO')

#**6.**

data = pd.read_csv('hofbatting.csv')

data.head()

data.describe().T

import numpy as np

data = pd.read_csv('hofbatting.csv')

mid_career_keys  = ['19 th Century', 'Dead Ball', 'Lively Ball',

 'Integration', 'Expansion', 'Free Agency', 'Long Ball']

mid_career_values = []

for row in data[['From', 'To']].values:

  From, To  = row[0], row[1]

 #up to the 1900 Season

  if To <= 1900:                    mid_career_values.append(mid_career_keys[0])

 #1901 through 1919

 elif From > 1900 and To <= 1919:  mid_career_values.append(mid_career_keys[1])

 #1920 through 1941

 elif From > 1920 and To <= 1941:  mid_career_values.append(mid_career_keys[2])

 #1942 through 1960

 elif From > 1942 and To <= 1960:  mid_career_values.append(mid_career_keys[3])

 #1961 through 1976

 elif From > 1961 and To <= 1976:  mid_career_values.append(mid_career_keys[4])

 #1977 through 1993

 elif From > 1977 and To <= 1993:  mid_career_values.append(mid_career_keys[5])

 #after 1993

 elif From > 1993:                 mid_career_values.append(mid_career_keys[6])

 else:

 mid_career_values.append('not-labled')

data['mid-career'] = mid_career_values

data.head()

data.groupby('mid-career')['mid-career'].value_counts()

data.groupby('mid-career').sum()

hist = data['mid-career'].hist()

data.plot.scatter(x = 'OBP', y = 'SLG')

OPS_values = []

for row in data[['OBP', 'SLG']].values:

 OPS_values.append(row[0] + row[1])

data['OPS'] = OPS_values

data.columns

data[['OBP', 'SLG', 'OPS']].head()

data['OPS'] = (data['OPS'] - data['OPS'].mean())/data['OPS'].std(ddof=0)

data['OPS'].head()

data.plot.scatter(x = 'OPS', y = 'mid-career')

HR_AB_values = []

for row in data[['HR', 'AB']].values:

 HR_AB_values.append(row[0] + row[1])

data['HR/AB'] = HR_AB_values

data['HR/AB']

df=data.groupby('mid-career')['HR/AB']

df.describe()

data.boxplot()
Similar Samples
Dive into our curated selection of programming homework samples at ProgrammingHomeworkHelp.com. Whether you're exploring Python, Java, Assembly, or Web Development, our examples offer practical insights and solutions. Designed to assist students and professionals alike, each sample showcases effective coding techniques and problem-solving strategies. Explore our diverse range of samples to bolster your understanding and excel in your programming endeavors.
Python
Python
Python
Python
Python
Python
Python
Python
Python
Python
Python
Python
Python
Python
Python
Python
Python
Python
Python
Python