Create A Program to Implement Data Frames and Machine Learning in Python Assignment Solution

- Instructions
- Requirements and Specifications
Instructions
Objective
If you're looking to excel in Python programming and require assistance with your data frames and machine learning project, fret not! We understand that mastering these concepts can be challenging, but you don't have to face it alone. Our team of expert programmers is here to provide top-notch Python assignment help, guiding you through the intricacies of data frames and machine learning. With their in-depth knowledge and experience, you can confidently tackle this task while gaining valuable insights into Python's powerful capabilities.
Requirements and Specifications
Source Code
import pandas as pd
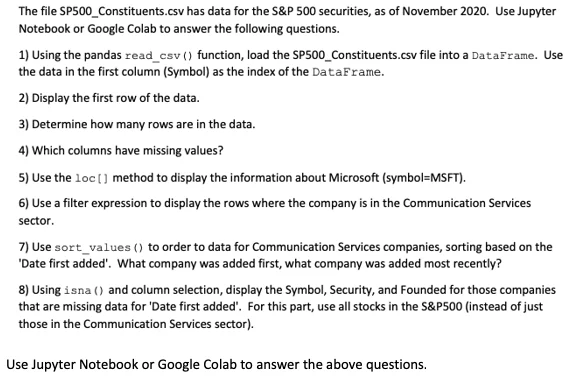
### 1) Read Data
df = pd.read_csv("SP500_Constituents.csv")
### 2) Display First Row
df.head(1)
### 3) Determine how many rows are in the data
print("There are " + str(len(df)) + " rows in the data")
### 4) Which columns have missing values?
The columns with True value are the ones that have missing values
df.isna().any()
### 5) Use loc[] method to display the information about Microsoft (symbol=MSFT)
df.loc[df["Symbol"] == "MSFT",:]
### 6) Use filter expression to display the rows where the company is in the Communication Services sector
For this case, we use a filter and locate the rows where the column **GICS Sector** has a value equal to **Communication Services**
comm_serv = df[df["GICS Sector"] == "Communication Services"]
comm_serv.head(len(comm_serv))
# From question 4, we saw that the column 'Date first added' has NaN values, So, delete these rows
comm_serv = comm_serv[comm_serv['Date first added'].notna()]
### 7) Use sort_values() to order to data for Communication Services companies, sorting based on the 'Date first added'. What company was added first, what company was added most recently?
# First, sort the data
comm_serv = comm_serv.sort_values(by=['Date first added'])
**Display the row for the company added first**
comm_serv.head(1)
**Display the row for the company added most recently**
comm_serv.tail(1)
### 8) Using isna() and column selection, display the Symbol, Security, and Founded for those companies that are missing data for 'Date first added'. For this part, use all stocks in the S&P500 (instead of just those in the Communication Services sector).
# Pick rows where 'Date first added' is na
data = df[df['Date first added'].isna()]
# Now pick the desired columns
data = data[['Symbol', 'Security', 'Founded']]
# Now, display all rows
data.head(len(data))
Similar Samples
At Programming Homework Help, explore our expertly crafted sample solutions. Each sample demonstrates our deep understanding of complex programming concepts, providing clear, concise, and effective code. Gain confidence in our services by reviewing these real examples of high-quality programming assignments.
Python
Python
Python
Python
Python
Python
Python
Python
Python
Python
Python
Python
Python
Python
Python
Python
Python
Python
Python
Python